
Colleagues and scholars from coast to coast, across Bass Strait and all the ships at sea.
Dateline: Federal Politics, 2011.
We are now 12 months on from the 2010 Federal Election and so I thought it an appropriate time to detail the current state of play.
The current polling numbers (tabled below) show that the ALP Government is trailing the Coalition Opposition by a substantial margin (suffering a 6.9 per cent swing since the 2010 Election) which, if replicated in an election, would see the Coalition win an additional 30 seats to hold over 100 seats in the House of Representatives (assuming a uniform swing).
Considering these numbers the question to ask is: Does the Gillard Government have any hope of winning the next election and a third term?
Based on history the short answer is - yes.
The Gillard Government's current polling woes are not unique.
Three of the last seven governments were in similar polling difficulty yet went on to win the next election: the ALP Government in 1993 and the Coalition Governments in 1998 and 2001, and in each case the respective leaders, Paul Keating (1993) and John Howard (1998 & 2001), were 'on the nose' at least as much as Julia Gillard is currently.
It is also noteworthy that both Opposition Leaders at the time, John Hewson (1993) and Kim Beazley (1998 & 2001), were more highly regarded by the electorate than Tony Abbott is currently.
The ALP's 1993 election victory involved a leadership change from Bob Hawke to Paul Keating, but in the Coalition's 1998 and 2001 election victories the poor polling numbers were all under John Howard yet he went on to win both of those elections for the Coalition.
If we ignore the circumstances of each of those past elections and indeed the current political circumstances (because that involves using opinion to find explanations for the results) and just look at the numbers, it indicates that it is not impossible for the Gillard Government to win.
This is also reflected in the estimation of the current probabilities of the next election's outcome (as determined by the average of five bookmakers' prices) which show that the Coalition is currently priced at 5/2 ON and the ALP at 5/2 AGAINST (excluding the bookmakers' betting margin) which means if the election were held 7 times the Coalition would win 5 times and the ALP 2 times.
These odds suggest that the Coalition has a 71 per cent chance of winning and the ALP 29 per cent.
Roy Morgan Research's question of its respondents: "Regardless of who you would like to win, who do you THINK will win the next Federal Election - The Liberal-National Coalition or the Labor Party" finds that 75 per cent think the Coalition will win and 25 per cent think the ALP will win.
So while there is a view that the ALP has next to zero chance of winning; history, probabilities and public opinion suggest otherwise.
Having attended a school that was sandwiched between the Tulloch Lodge training stables of the legendary T J Smith (now occupied by his daughter Gai Waterhouse) and Royal Randwick Racecourse, we became familiar with two things:
1. The aroma of horse stables wafting over as we ate our lunch, and
2. The great stories of the turf.
One of the greatest stories was that of the champion racehorse of the 1930's, Ajax, who had won 18 consecutive races and started in the 1939 Rawson Stakes at Rosehill Racecourse, in a three horse race, at odds of 40/1 ON (a 98 per cent chance of winning) - and lost.
At the racetrack old timers would always say in response to a declaration that something in a race was a sure thing to win "Son, let me tell you about a horse called Ajax......"
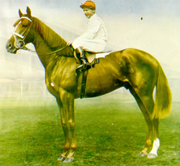
Champion racehorse: Ajax
The current polling numbers
Aggregating and weighting the polling data collected during August from Newspoll, Nielsen, Essential, Galaxy and Morgan (phone poll) we can see that since the 2010 Election the ALP has lost 8.2 per cent of its primary vote, the Coalition has increased its primary vote by 5 per cent, the Greens are effectively holding the same support as they had in the election losing just 0.1 per cent of its primary vote, and other parties and Independents have increased their combined primary votes by 3.3 per cent.
In two party preferred terms (TPP) this translates to a 6.9 per cent swing against the Government which, if replicated at an election, would result in the Coalition holding over 100 seats in the House of Representatives (assuming a uniform swing).
ALP | L-NP | GRNS | OTH | Two Party Preferred | |
Election August 2010 | 38 | 43.6 | 11.8 | 6.6 | ALP 50.1 L-NP 49.9 |
Polling August 2011 | 29.8 | 48.6 | 11.7 | 9.9 | ALP 43.2 L-NP 56.8 |
Change | (-8.2) | +5 | -0.1 | +3.3 | ALP(-6.9) L-NP +6.9 |
(sample size 10,550 margin of error 1%)
How does the Gillard Government's current position compare to other governments, one year into their respective terms?
Newspoll data only, which commenced polling in 1985, figures are rounded:
Government | TPP % | Next election TPP % | Change from polling % | Govt won or lost election |
1st Howard Govt (96 - 98) | 55 | 49 | (-6) | won |
Rudd-Gillard Govt (07-10)* | 55 | 50 | (-5) | won (minority) |
2nd Hawke Govt (84 – 87) | 54 | 51 | (-3) | won |
3rd Howard Govt (01 – 04) | 53 | 53 | nil | won |
3rd Hawke Govt (87 – 90) | 52 | 50 | (-2) | won |
Keating Govt (93 – 96) | 51 | 46 | (-5) | lost |
2nd Howard Govt (98 – 01) | 51 | 51 | nil | won |
4th Howard Govt (04 – 07) | 48 | 47 | (-1) | lost |
4th Hawke-Keating Govt (90 – 93)** | 44 | 51 | +7 | won |
Gillard Govt August 2011 | 44 | TBD | TBD | TBD |
*Gillard replaced Rudd, June 2010 **Keating replaced Hawke, December 1991. (TPP figures are estimates based on actual preference flows achieved at the next election)
This table shows that the only government that was this far behind in the polls, one year into its term, was the ALP Government in March 1991, which subsequently went on to win the next election in 1993.
It did, however, change leaders from Bob Hawke to Paul Keating at the end of 1991.
It is interesting to note that there have been quite large changes in support for past governments when you compare their positions one year into their terms with the actual election result, although all but one of those shifts was against the government of the day.
This illustrates what is happening now may not be indicative of what will happen in the election. Reinforcing once again that polls are reflective, not predictive.
What about at other times apart from one year into a term?
Comparisons to a particular time, such as one year into a term, give us a benchmark from which we can measure.
There were other times (outside the one year anniversary period) in which previous governments were in polling trouble yet went on to win the next election by attracting back voter support.
Voting intentions TPP % | Govt. | Opposition | Govt. Election TPP | Govt. result |
March 1991 Hawke PM | 44 | 56 | 51 (+7 back to govt.) | won (Keating PM) |
Feb 1992 Keating PM | 43 | 57 | 51 (+8 back to govt.) | won |
June 1998 Howard PM | 44 | 56 | 49 (+5 back to govt.) | won |
March 2001 Howard PM | 42 | 58 | 51 (+9 back to govt.) | won |
August 2011 Gillard PM | 44 | 56 | TBD | TBD |
(Newspoll data only)
This table shows the three governments that were in similar polling trouble to that of the Gillard Government (ALP 1993 and Coalition 1998 & 2001) managed to haul back the substantial leads of the oppositions at the time and went on to win the election.
Significantly, all three governments were still in polling difficulties much less than one year out from the election. (The ALP in 1993 had taken an election winning lead by the last quarter of 1992 only to have it all evaporate in 1993 and was in the lead again only on the March election night).
How did the leaders' ratings compare at those times? (Newspoll data only)
Gillard's current poor numbers compare similarly with these previous prime ministers.
Prime Minister | Satisfaction | Dissatisfaction | Net result | PM Result |
March 1991 Hawke | 32 | 62 | (-30) | replaced by Keating end '91 |
July 1992 Keating* | 24 | 68 | (-44) | won election |
June 1998 Howard | 28 | 59 | (-31) | won election |
March 2001 Howard | 28 | 64 | (-36) | won election |
August 2011 Gillard | 29 | 61 | (-32) | TBD |
* (The July measure is used as it takes about six months for a new leader's ratings to settle down).
Tony Abbott's current poor numbers compare unfavourably with these previous opposition leaders.
Opposition Leader | Satisfaction | Dissatisfaction | Net result | O/L Result |
March 1991 Hewson | 45 | 39 | +6 | lost election |
Feb 1992 Hewson | 52 | 32 | +20 | lost election |
June 1998 Beazley | 43 | 39 | +4 | lost election |
March 2001 Beazley | 39 | 47 | (-8) | lost election |
August 2011 Abbott | 36 | 55 | (-19) | TBD |
And so, when you combine the two leaders, Gillard compares favourably.
Better Prime Minister | PM | Opp’n Leader | Net result | PM Result |
March 1991 | 38 (Hawke) | 35 (Hewson) | PM +3 | replaced by Keating end '91 |
Feb 1992 | 30 (Keating) | 45 (Hewson) | PM (-15) | won election |
June 1998 | 32 (Howard) | 38 (Beazley) | PM (-6) | won election |
March 2001 | 35 (Howard) | 41 (Beazley) | PM (-6) | won election |
August 2011 | 38 (Gillard) | 39 (Abbott) | PM (-1) | TBD |
Conclusion
The ALP and Julia Gillard are clearly travelling poorly according to the polling data.
However this is not unique in Australian politics, yet governments who were travelling just as poorly were returned at the next election.
To suggest the Coalition is well placed is correct, and to suggest it is preferable to be in its position than the ALP's is unremarkable, but to suggest the election result is all over would be premature.
While there is a view that there has never been such anger in the electorate towards a government and this is why the Government is doomed, it is worth remembering there has been similar anger several times before (as evidenced by the above polling data) and on three occasions the government of the day still won - in 1993, 1998 and 2001.
And while there is also a view that it is difficult to see how the current Government will 'turn it around', it was similarly difficult to see at the time in 1993, 1998 and 2001, yet somehow all three governments managed to 'turn it around'.
The current probabilities (as determined by bookmaker odds and public opinion) suggest that the Coalition has over a 70 per cent chance of winning the election - a strong position - but it is not 100 per cent and nor can it be.
This might give the Coalition just a little cause for concern and the ALP just a little cause for hope.
In that context it is worthwhile to remember these sage words of the old timers "Son, let me tell you about a horse called Ajax......" and to learn from the well documented experience of this fine judge of racing form, Skippy the Bush Kangaroo, who backed Wallaby Bill at 33/1 (a slender 3 per cent of winning) and collected a bundle. You can see the historic footage here

Astute punter: Skippy the Bush Kangaroo.


No comments:
Post a Comment